

We are living in very interesting times. After a decade of historically low-interest rates and aggressive monetary policy from the Federal Reserve, we finally see the inflation that many were predicting. Although it took a global pandemic and our first war in Europe in decades to shake it out, higher prices are here. But you didn’t need me to tell you that. For this market update, we want to focus on what’s happening locally. We see all the national and regional headlines, but often we say, “Yeah, but what does that mean for my neighborhood?”. Because it is what Farmhouse Realty focuses on, this update will be on what is happening with detached single-family homes in the 30338 zip code. Although we do service surrounding zip codes, we feel like 30338 is a good proxy for what is happening in North Atlanta.
Here is a headline number for you: May 2022 concluded with the highest average sales price ever for Dunwoody at $768,263 with 38 homes closed. If you were an average seller of a Dunwoody home in May of 2019 before all this madness was unleashed you would have sold for $537,801. That’s a 42.9% increase!!! Wowzers. Now keep in mind, that is only comparing one month of data to another month of data three years ago. To get a real picture of what is happening and what the current trend is, we have cut and diced the data to give you the non-headline figures. They are still impressive, but not as impressive as some of the national numbers you have been hearing.
Quick side note on my history with numbers. I’m a former CPA that worked at KPMG for 11 years doing M&A due diligence. Essentially I helped clients buy and sell companies. To figure out what a fair price was for these transactions, I would do hours and hours of analysis to determine trends in the company’s financials. There would always be some weird data points in any given month. Maybe there was a random inventory shortage, a big customer loss, a big one-off customer order, a labor strike, seasonality in the business, you name it. We found that to take out all that month-to-month mess when analyzing figures, we would do a rolling 12-month analysis on a lot of statistics. This means that the data point shown is based on the last 12 months of data. It smooths things out and allows you to see real trends.
That being said, the statistics we will show you for detached home sales in the 30338 zip code are based on a rolling 12 months. That means any data point you see is based on the sum or average of the last 12 months from that date.

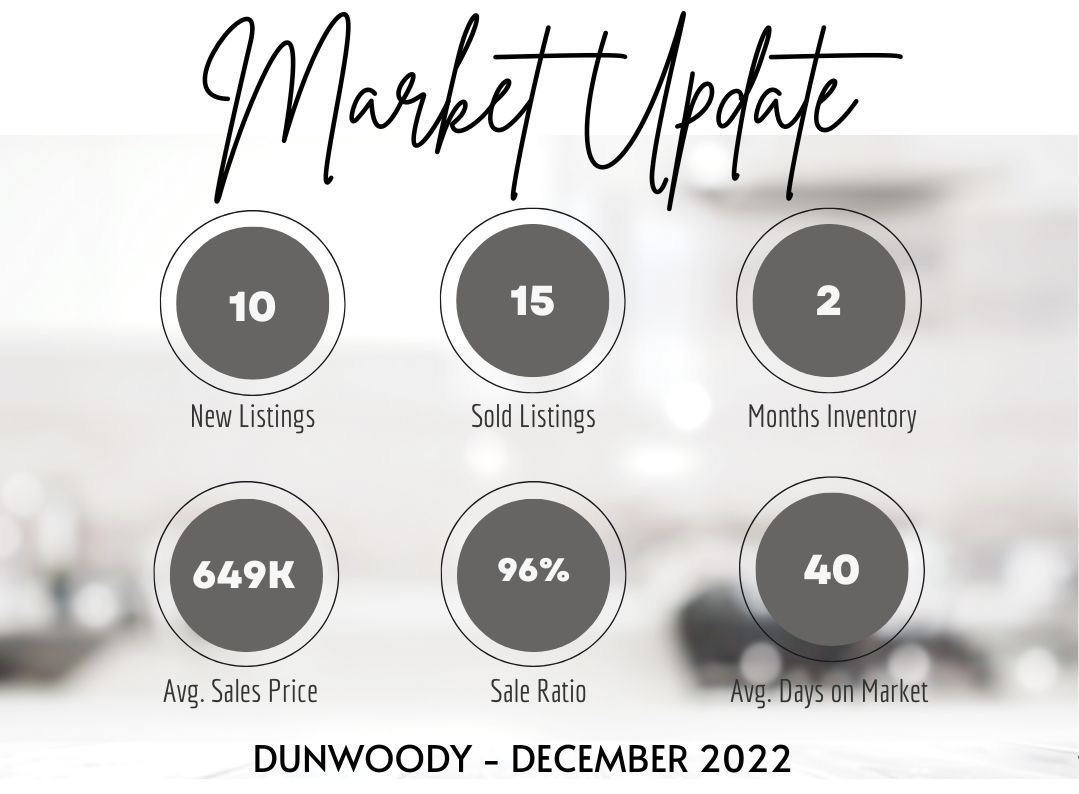
As of the end of May 2022, the rolling 12-month average sales price was $657,169. This compares to $596,007 for May 2021 and $535,474 for May 2020. So an increase of 11.3% was experienced from 2020 to 2021 and an increase of 10.3% from 2021 to 2022. This is well below some of the headline numbers you may be seeing in the national news and slightly above the recently published inflation figure of 8.6%.

Another statistic we have found interesting is the number of detached single-family homes sold in 30338 over this time period. The media would lead you to believe that there are no homes to purchase. We certainly feel like that is the case for our buyers. It has been hard work locking up a home the past two years. That being said, we have seen an increase in the number of homes sold on a rolling 12-month basis. For the 12 months ending May 2022, 412 homes have been sold. This compares to 376 in May 2021 and 302 in May 2020. So the number of homes sold is actually up! Now that doesn’t mean that inventory has been up. The demand from buyers has been so strong that these homes are selling in a record amount of time and keeping the active number of homes on the market at record lows. BUT, people are selling!

And finally, the last statistic we’d like to show you this month. Pricing growth! The chart above shows the annual increase of the average 30338 home price on a rolling 12-month basis. Prices are up and from the looks of it, they will continue to be up. Just not as much on a percentage basis as before. This declining chart does not indicate that prices are falling, it simply indicates that prices are not rising as fast as they were for much of 2021. This is what we believed would happen in 2022. In theory, this trend should settle out to around the inflation rate reported by our government. So if inflation is 8.6%, then we should see home prices rising around that rate. Now keep in mind that real estate prices are hyper-local and therefore the 30338 zip code may outperform or underperform inflation. That is the real indicator of how our local market here is performing.
Summary:
Prices are up and more people are selling their homes. That is the good news if you are a homeowner in 30338. The bad news is that we don’t appear to be performing as well as the nation as a whole and in fact, we may start experiencing growth rates less than inflation in the near future if current trends continue. What does that mean? It means that although your home value will still be increasing, it will be increasingly less than inflation. That’s not good. That means you could be seeing a bubble deflating right before your eyes even though prices are increasing. Think about that one for a minute to wrap your head around! Should you sell, should you buy, or should you stay put?!?! The answer is, it depends. We think we know what to expect for your neighborhood going forward and we can communicate why we expect it. There are big macro events impacting home values but there are also several micro-events impacting 30338. This is where hiring a local knowledgeable agent comes in handy and we will be happy to share that information and more with all of our clients!

Join The Discussion